Code Snippets#
Annotate your variants#
This example shows how you can annotate your variants. Running the command below will output a pandas dataframe.
import missionbio.mosaic as ms
sample = ms.load_example_dataset("3 cell mix")
filtered_variants = list(sample.dna.filter_variants())

sample.dna.get_annotations(filtered_variants[0:5])
| Position | Ref allele | Alt allele | Varsome url | Variant type | RefSeq transcript id | Gene | Protein | cDNA | Coding impact | Function | Allele Freq (gnomAD) | DANN | dbSNP rsids | ClinVar | COSMIC ids | |
|---|---|---|---|---|---|---|---|---|---|---|---|---|---|---|---|---|
| Variant ID | ||||||||||||||||
| chr2:25458546:C/T | 25458546 | C | T | https://varsome.com/variant/hg19/chr2:25458546... | SNV | NM_022552.5 | DNMT3A | DNMT3A:p.p.? | c.2597+30G>A | intronic | 0.513776 | 0.551042 | rs2304429 | Benign | ||
| chr2:25469502:C/T | 25469502 | C | T | https://varsome.com/variant/hg19/chr2:25469502... | SNV | NM_022552.5 | DNMT3A | DNMT3A:p.L422= | c.1266G>A | synonymous | coding | 0.190004 | 0.802194 | rs2276598 | Benign | |
| chr2:25470426:C/T | 25470426 | C | T | https://varsome.com/variant/hg19/chr2:25470426... | SNV | NM_022552.5 | DNMT3A | DNMT3A:p.p.? | c.1014+34G>A | intronic | 0.000702 | 0.635212 | rs142243425 | |||
| chr2:25470573:G/A | 25470573 | G | A | https://varsome.com/variant/hg19/chr2:25470573... | SNV | NM_022552.5 | DNMT3A | DNMT3A:p.R301W | c.901C>T | missense | coding | 0.999237 | rs1553414070 | Conflicting Interpretations Of Pathogenicity | ||
| chr2:209113192:G/A | 209113192 | G | A | https://varsome.com/variant/hg19/chr2:20911319... | SNV | NM_005896.4 | IDH1 | IDH1:p.G105= | c.315C>T | synonymous | coding | 0.05057 | 0.680929 | rs11554137 | Benign |
Currently we provide the following annotations:
Variant type
Gene
Gene function
RefSeq transcript ID
cDNA change
Protein change
Protein coding impact
COSMIC
DANN SNVs
ClinVar
gnomAD
dbSNP
If you need additional annotation sources, please contact us.
Multi-assay heatmap#
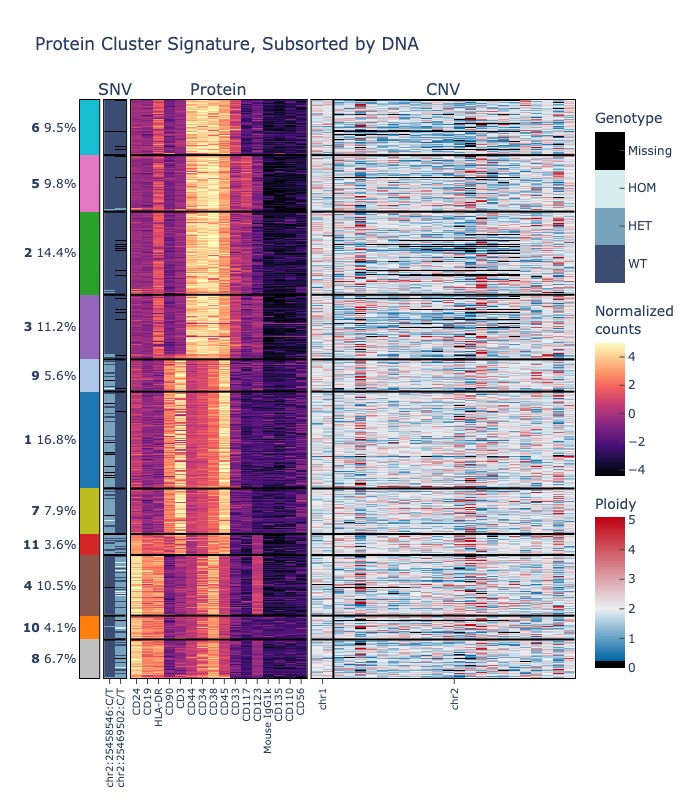
The following examples demonstrate how to produce a heatmap showing data from multiple assays. The first example shows how to cluster cells by protein expression, then produce a heatmap that shows the per-cluster protein expression and DNA mutation status for some select variants.
import missionbio.mosaic as ms

sample = ms.load_example_dataset("3 cell mix")

# first, cluster by protein expression
sample.protein.normalize_reads()
sample.protein.run_pca(attribute='normalized_counts', components=5)
sample.protein.run_umap(attribute='pca')
sample.protein.cluster(attribute='pca', method='graph-community', k=100)

# show only two DNA variants, and chromosomes 1 and 2 for CNV
fig = sample.heatmap(("protein", "dna", "cnv"), features=(None, sample.dna.ids()[:2], ["1", "2"]))
fig.show("jpg")
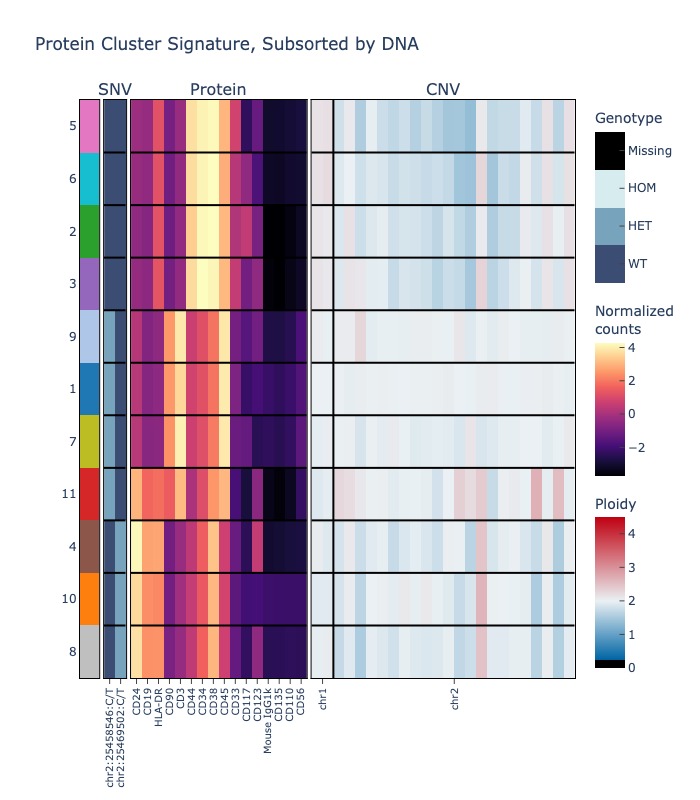
If you cluster by protein, you can also quantify the percentage and mutated cells in each cluster for your mutation(s) of choice.
import missionbio.mosaic as ms

sample = ms.load_example_dataset("3 cell mix")

# first, cluster by protein expression
sample.protein.normalize_reads()
sample.protein.run_pca(attribute='normalized_counts', components=5)
sample.protein.run_umap(attribute='pca')
sample.protein.cluster(attribute='pca', method='graph-community', k=100)

# show only two DNA variants

fig = sample.signaturemap(("protein", "dna", "cnv"), features=(None, sample.dna.ids()[:2], ["1", "2"]))
fig.show("jpg")
Fishplot to visualize clonal evolution#
Draws a fish plot and associated graphical representation of clonal phylogeny. Currently, you must provide the phylogenetic relationships between clones.
import missionbio.mosaic as ms

group = ms.load_example_dataset('Multisample PBMC')
fig = group.fishplot(labels=["Clone 1", "Clone 2"], parents=[None, None])
fig.show("jpg")

Group cells by a select number of DNA variants#
Clusters cells into clones based on the provided variants and returns a dataframe of per-clone and per-variant statistics. This algorithm also takes into consideration allele dropout out (ADO) to identify potential false positive clones.
import missionbio.mosaic as ms

sample = ms.load_example_dataset('3 cell mix')
filtered_variants = sample.dna.filter_variants()
sample.dna.group_by_genotype(features=filtered_variants[0:5])
| clone | 1 | 2 | 3 | 4 | 5 | 6 | 7 | 8 | 9 | 10 | Missing GT clones (40) | Small subclones (28) | ADO clones (0) |
|---|---|---|---|---|---|---|---|---|---|---|---|---|---|
| chr2:25458546:C/T | Het (47.13%) | WT (0.6%) | WT (0.7%) | WT (0.57%) | WT (0.77%) | WT (1.9%) | WT (31.26%) | WT (0.87%) | Het (31.88%) | Het (27.22%) | Missing in 2.75% of cells | Het (24.13%) | NaN |
| chr2:25469502:C/T | WT (0.41%) | WT (0.14%) | Het (47.72%) | WT (0.19%) | WT (0.3%) | WT (2.08%) | WT (0.61%) | Hom (98.01%) | WT (0.61%) | Het (29.8%) | Missing in 3.84% of cells | WT (10.45%) | NaN |
| chr2:25470426:C/T | WT (0.77%) | Het (61.2%) | WT (0.55%) | WT (10.57%) | Hom (98.75%) | WT (1.19%) | WT (0.95%) | WT (0.79%) | WT (1.84%) | WT (0.52%) | Missing in 7.71% of cells | WT (22.67%) | NaN |
| chr2:25470573:G/A | Het (45.5%) | WT (0.98%) | WT (0.82%) | WT (0.96%) | WT (1.2%) | WT (1.18%) | Het (40.29%) | WT (0.54%) | WT (3.54%) | Het (29.29%) | Missing in 2.75% of cells | Het (31.98%) | NaN |
| chr2:209113192:G/A | WT (0.74%) | Het (50.96%) | WT (0.67%) | Het (51.42%) | Het (50.82%) | WT (0.84%) | WT (0.75%) | WT (1.12%) | WT (1.24%) | WT (0.72%) | Missing in 0.32% of cells | WT (18.41%) | NaN |
| Total Cell Number | 542 (21.89%) | 436 (17.61%) | 348 (14.05%) | 205 (8.28%) | 159 (6.42%) | 114 (4.6%) | 79 (3.19%) | 56 (2.26%) | 46 (1.86%) | 31 (1.25%) | 302 (12.2%) | 158 (6.38%) | NaN |
| 3 cell mix Cell Number | 542 (21.89%) | 436 (17.61%) | 348 (14.05%) | 205 (8.28%) | 159 (6.42%) | 114 (4.6%) | 79 (3.19%) | 56 (2.26%) | 46 (1.86%) | 31 (1.25%) | 302 (12.2%) | 158 (6.38%) | NaN |
| Parents | NaN | NaN | NaN | [small, 2, small] | [2] | [small, 3, 4, 7] | [1] | [3] | [1] | NaN | NaN | NaN | NaN |
| Sisters | NaN | NaN | NaN | [small, 5, small] | [4] | [small, 8, small, small] | [small] | [6] | [small] | NaN | NaN | NaN | NaN |
| ADO score | 0 | 0 | 0 | 0.679728 | 0.833091 | 0.886213 | 0.369933 | 0.994591 | 0.978414 | 0 | NaN | NaN | NaN |