Data structure#
H5 File Structure#
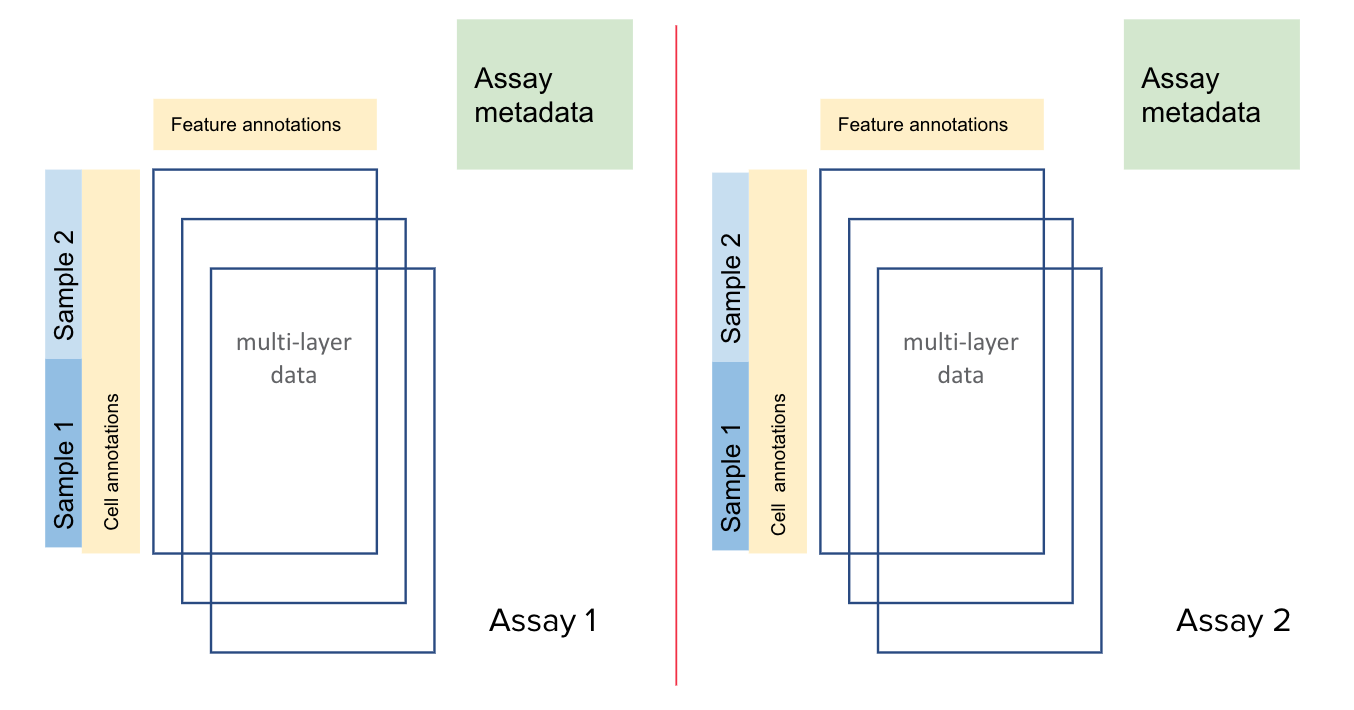
The Tapestri Pipeline generates a .h5 output file. It is a multi-omics file with data stored in
a structured HDF5 file. This file may contain data for
one or more assays (DNA, Protein, CNV etc.). Each assay may contain data for one or more samples.
Each assay contains row attributes, column attributes, and layers. These are described in more detail
in the following sections.
Mosaic Sample Structure#
Mosaic can read and write the data stored in the .h5 file. Loading a single sample h5 file
returns a Sample object. It contains information for all assays
and raw counts of the sample. Whereas loading a multi-sample h5 file returns a
SampleGroup object, which is a collection of Sample objects.
Single Sample H5 File
---------------------

     Sample
       |
       |-- dna
       |-- cnv
       |-- protein
       |-- cnv_raw
       |-- protein_raw
       |-- ...

Mutli-Sample H5 File
--------------------

     SampleGroup
       |
       |-- sample1
       |-- sample2
       |-- sample3
       |-- ...
The assays are stored as attributes of the Sample object. Each assay is an instance of a class that
inherits from _Assay. It contains generic functions for visualizing
while the subclasses are specific.
 missionbio.mosaic.assay._Assay
(basic interactivity and plotting)
               |
               |
   ---------------------------
   |           |             |
   |           |             |
   |           |             |
  Dna         Cnv         Protein
  (Assay-specific functionality)
Hint
missionbio is the top level package name Mission Bio uses for its software packages.
missionbio.h5 is the package used to read/write/process .h5 files, which then gets used
by the missionbio.mosaic package.
_Assay is the base class for each type of assay.
Dna, Cnv, and
Protein are subclasses of
_Assay, so they inherit all of its plotting and interactive
functionality. However, each class also includes methods specific to the assay, such as
normalization and cell type identification. Each assay stores the information in four main
attributes:
- metadata (
add_metadata()/del_metadata()):Dictionary containing the metrics of the assay (e.g. sample name).
- row_attrs (
add_row_attr()/del_row_attr()):Dictionary containing meta information for each barcode/cell in the assay (e.g. basepair sequence for each barcode, barcode label, etc.). All the values must be of the same length, i.e., match the number of barcodes. This is the attribute where ‘label’, ‘pca’, and ‘umap’ values are added.
- col_attrs (
add_col_attr()/del_col_attr())):Dictionary containing meta information for each feature measured in the assay (i.e. variants from a DNA assay, antibodies from a protein assay, etc.). All the values must be of the same length, i.e., match the number of ids. ‘ids’ contains variants for DNA assays and antibodies for Protein assays.
- layers (
add_layer()/del_layer()):Dictionary containing the values for each barcode and feature combination measured in the assay (e.g. read_counts, genotype, etc.). All the values have the shape (number barcodes) x (number features).
info (
has_info()/add_info()/del_info())This can be used to store arbitrary information of various types including dictionaries and pandas dataframes. Unlike row attributes, column attributes, and layers, it is not confined by any shape. The assays also now store their palette in the info as a dictionary. info is a dictionary of dictionaries. To access the info for any one of the samples in the assay use assay.info[<sample_name>].
sampleinfo()is a shortcut for accessing info for single sample assays.>>> sample.dna[sample.dna.samples().pop()]["palette"] # Accessing the palette dictionary >>> sample.dna.sampleinfo["palette"] # Shorthand to access the info for single sample assays
DNA#
Described here are common types and descriptions of data stored in each layer of the DNA assay.
Hint
Mosaic provides a default level of cell and variant filtering (but does not remove any of the cells by default). The results of the filtering are contained in sample.dna.layers[‘FILTER_MASK’], sample.dna.col_attrs[‘filtered’], sample.dna.row_attrs[‘filtered’], n_passing_variants, n_passing_cells, and n_passing_variants_per_cell. The parameters that control that filtering are af_cutoff, dp_cutoff, gq_cutoff, missing_cells_cutoff, missing_variants_cutoff, and mutated_cells_cutoff.
Metadata#
Value name |
Description |
|---|---|
sample_name |
The sample name. |
ado_rate |
The estimated rate of allelic dropout. |
af_cutoff |
Minimum variant allelic fraction used when computing sample.dna.layers[‘FILTER_MASK’], sample.dna.col_attrs[‘filtered’], and sample.dna.row_attrs[‘filtered’], as well as the filtered variant metrics such as n_passing_variants, n_passing_cells, and n_passing_variants_per_cell. Does not actually remove any variants from the assay. |
avg_mapping_error_rate |
Ratio of mismatches to bases mapped (see samtools stats). |
avg_panel_uniformity |
The proportion of amplicons that pass the panel uniformity test (see here for more information). |
chemistry_version |
The version of the Tapestri kit used. |
dp_cutoff |
Minimum variant depth of coverage when computing sample.dna.layers[‘FILTER_MASK’], sample.dna.col_attrs[‘filtered’], and sample.dna.row_attrs[‘filtered’], as well as the filtered variant metrics such as n_passing_variants, n_passing_cells, and n_passing_variants_per_cell. Does not actually remove any variants from the assay. |
genome_version |
The genome version used for mapping and variant calling. |
gq_cutoff |
The minimum variant genotype quality when computing sample.dna.layers[‘FILTER_MASK’], sample.dna.col_attrs[‘filtered’], and sample.dna.row_attrs[‘filtered’], as well as the filtered variant metrics such as n_passing_variants, n_passing_cells, and n_passing_variants_per_cell. Does not actually remove any variants from the assay. |
high_quality_variants |
Number of variants with QUAL values greater than a minimum threshold. |
missing_cells_cutoff |
Variants that cannot be genotyped (i.e. NGT is equal to 0, 1, or 2) in more than this percentage of cells are not used when calculating sample.dna.col_attrs[‘filtered’] the filtered variant metrics such as n_passing_variants and n_passing_variants_per_cell. Does not actually remove any variants from the assay. |
missing_variants_cutoff |
Cells that have more than this percentage of filtered variants that cannot be genotyped (i.e. NGT is equal to 0, 1, or 2) are not used when calculating sample.dna.row_attrs[‘filtered’] and the filtered variant metrics such as n_passing_cells and n_passing_variants_per_cell. Does not actually remove any cells from the assay. |
mutated_cells_cutoff |
Variants that are not mutated (i.e. NGT is equal to 1 or 2) in more than this percentage of cells are not used when calculating sample.dna.col_attrs[‘filtered’] and the filtered variant metrics such as n_passing_variants and n_passing_variants_per_cell. Does not actually remove any variants from the assay. |
n_amplicons |
Number of amplicons in the panel. |
n_bases_r1 |
Number of bases from the forward reads. |
n_bases_r1_q30 |
Number of bases that have a Q value of 30 or greater from the forward reads. |
n_bases_r2 |
Number of bases from the reverse reads. |
n_bases_r2_q30 |
Number of bases that have a Q value of 30 or greater from the reverse reads. |
n_cell_barcode_bases |
Total number of bases from cell barcodes. |
n_cell_barcode_bases_q30 |
Total number of bases (with quality of 30 or greater) from cell barcodes. |
n_cells |
Number of cells. |
n_passing_cells |
Number of passing cells. |
n_passing_variants |
Number of passing variants. |
n_passing_variants_per_cell |
Median number of mutations (among the passing variants) per passing cell. Here, mutations refers to variants where the NGT is equal to 1 or 2. |
n_read_pairs |
Number of read pairs. |
n_read_pairs_mapped_to_cells |
Number of read pairs that mapped to cells. |
n_read_pairs_trimmed |
Number of read pairs that passed trimming. |
n_read_pairs_valid_cell_barcodes |
Number of read pairs from cell barcodes that are valid. |
n_reads_mapped |
Number of read pairs that mapped to the genome. |
n_reads_mapped_insert |
Total number of reads that map to the amplicons. |
n_variants_per_cell |
Median number of mutations per cell. Similar to n_passing_variants_per_cell, but the variants and cells were not filtered. |
panel_name |
The name of the panel. |
pipeline_version |
The Tapestri pipeline version used. |
Layers#
Value name |
Description |
|---|---|
AF |
The allelic fraction of the variant in each cell/barcode (ranges from 0 to 100). Missing values are set to 0. |
AF_MISSING |
The allelic fraction of the variant in each cell/barcode (ranges from 0 to 100). Missing values are set to -50. |
DP |
Approximate read depth (reads with MQ=255 or with bad mates are filtered) of the variant position in each cell/barcode. |
FILTER_MASK |
Contains values of 0 (variant passed) or 1 (variant did not pass). Variants that pass the GQ, DP, and AF thresholds listed in the metadata. Applies to only those variants mutated in at least x% of cells (default if 1%). |
GQ |
The genotype quality for the variant (from GATK) in each cell/barcode. |
NGT |
The genotype in each cell/barcode. 0: is wildtype, 1: one allele is alternate, 2: both alleles are alternate, 3: Missing genotype (e.g. not enough depth of coverage). |
RGQ |
Unconditional reference genotype confidence, encoded as a phred quality -10*log10 p(genotype call is wrong). |
NGT_FILTERED |
The genotype information after calling assay.dna.filter_variants() in each cell/barcode. 0: is wildtype, 1: one allele is alternate, 2: both alleles are alternate, 3: Missing genotype (e.g. not enough depth of coverage). |
Column attributes#
Value name |
Description |
|---|---|
ALT |
The alternate allele for each variant. |
CHROM |
The chromosome for each variant. |
POS |
The genomic position for each variant. |
QUAL |
The genotype quality for each variant (from GATK). |
REF |
The reference allele for each variant. |
ado_gt_cells |
The percentage of cells genotyped at the variant’s position. Set to -1 if ADO is not or cannot be estimated for the variant. |
ado_rate |
The estimated allelic dropout for the variant. Set to -1 if it cannot be estimated. |
amplicon |
The ID of the amplicon the variant is in. |
filtered |
1 if the variant did not passed default filtering, otherwise 0. |
id |
The id of the variant. |
Row attributes#
Value name |
Description |
|---|---|
barcode |
The basepair sequence for the barcode/cell. |
filtered |
1 if the cell/barcode did not passed default filtering, otherwise 0. |
sample_name |
The sample name. |
CNV#
Metadata#
Value name |
Description |
|---|---|
sample_name |
The sample name. |
ado_rate |
The estimated rate of allelic dropout. |
avg_mapping_error_rate |
Ratio of mismatches to bases mapped (see samtools stats). |
avg_panel_uniformity |
The proportion of amplicons that pass the panel uniformity test (see here for more information). |
genome_version |
The genome version used for mapping and variant calling. |
n_amplicons |
Number of amplicons in the panel. |
n_bases_r1 |
Number of bases from the forward reads. |
n_bases_r1_q30 |
Number of bases that have a Q value of 30 or greater from the forward reads. |
n_bases_r2 |
Number of bases from the reverse reads. |
n_bases_r2_q30 |
Number of bases that have a Q value of 30 or greater from the reverse reads. |
n_cell_barcode_bases |
Total number of bases from cell barcodes. |
n_cell_barcode_bases_q30 |
Total number of bases (with quality of 30 or greater) from cell barcodes. |
n_cells |
Total number of bases from cell barcodes. |
n_read_pairs |
This is the number of total read pairs in the fastq file. |
n_read_pairs_mapped_to_cells |
Number of read pairs that mapped to cells. |
n_read_pairs_trimmed |
Number of read pairs that passed trimming. |
n_read_pairs_valid_cell_barcodes |
Number of read pairs from cell barcodes that are valid. |
n_reads_mapped |
Number of read pairs that mapped to the genome. |
n_reads_mapped_insert |
Total number of reads that map to the amplicons. |
panel_name |
The panel name. |
pipeline_version |
Pipeline version used to produce the data. |
Layers#
Value name |
Description |
|---|---|
read_counts |
The total read counts within the amplicon |
Column attributes#
Value name |
Description |
|---|---|
id |
The ID of the amplicon. |
CHROM |
The chromosome for each variant. |
start_pos |
The start position of the amplicon. |
end_pos |
The end position of the amplicon. |
r1_counts |
The count of R1 reads within the amplicon across all barcodes/cells. |
r2_counts |
The count of R1 reads within the amplicon across all barcodes/cells. |
Row attributes#
Value name |
Description |
|---|---|
barcode |
The basepair sequence for the barcode/cell. |
label |
Per-barcode labels. |
sample_name |
The sample name. |
Protein#
Metadata#
Value name |
Description |
|---|---|
sample_name |
The sample name. |
n_antibodies |
Total number of antibodies measured in the assay. |
n_bases_r1 |
Number of bases from the forward reads. |
n_bases_r1_q30 |
Number of bases that have a Q value of 30 or greater from the forward reads. |
n_bases_r2 |
Number of bases from the reverse reads. |
n_bases_r2_q30 |
Number of bases that have a Q value of 30 or greater from the reverse reads. |
n_cell_barcode_bases |
Total number of bases from cell barcodes. |
n_cell_barcode_bases_q30 |
Total number of bases (with quality of 30 or greater) from cell barcodes. |
n_read_pairs |
This is the number of total read pairs in the fastq file. |
n_read_pairs_after_candidate_barcode_filtering |
Total number of reads mapping to good quality barcodes. |
n_reads_trimmed |
Total number of reads that passed trimming. |
n_reads_valid_ab_barcodes |
Total number of reads belonging to valid antibody. |
n_reads_valid_cell_barcodes |
Total number of reads belonging to valid cell barcodes. |
panel_name |
The panel name. |
pipeline_version |
Pipeline version used to produce the data. |
Layers#
Value name |
Description |
|---|---|
read_counts |
The total read counts within each barcode/antibody combination. |
normalized_counts |
Normalized read counts. Only present after running sample.protein.normalize_reads(). |
scaled_counts |
Z-score normalized counts. Only present after running sample.protein.scale_data(). |
Column attributes#
Value name |
Description |
|---|---|
id |
The ID of the antibody. |
antibody_id |
The ID of the antibody. |
antibody_sequence |
The basepair sequenced tagged to the antibody. |
Row attributes#
Value name |
Description |
|---|---|
barcode |
The basepair sequence for the barcode/cell. |
label |
Per-barcode labels. |
sample_name |
The sample name. |
pca |
PCA coordinates for each cell. Only present after running sample.protein.run_pca(). |
umap |
UMAP coordinates for each cell. Only present after running sample.protein.run_umap(). |